House Prices in the South West
We are delighted to report the latest data focuing on average house prices, the total number of sales and the size of the market around the country, focusing on the hotspots within the South West.
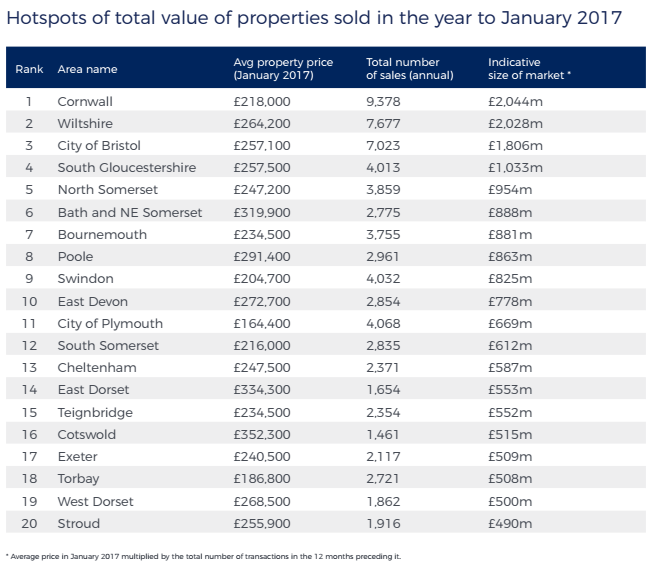
The figures are based on the latest data from the Land Registry House Price Index which helps to form a picture of the region’s housing markets. While there is no single measure which provides a complete picture of the market, below are 20 areas with statistics on the total value of all property transactions in the past year. This has been calculated by multiplying the average value of homes by the number of sales.
Market snapshot:
- The district with the largest market is Cornwall which saw £2,044m worth of transactions in the year to January 2017.
- This was followed by Wiltshire with £2,028m worth of sales over the same period.
- The district with the highest overall average house price was Cotswold where prices sit at £352,300, which is 54% above the national average.
- The market with the highest number of transactions was Cornwall with 9,378 sales occurring during the period.
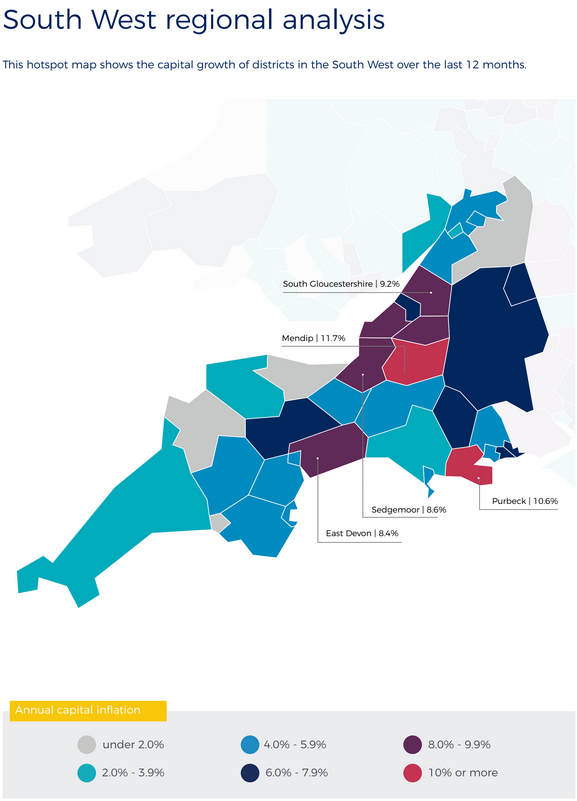
Where have house prices increased the most? Here are five districts with the highest annual capital growth.